
 Quality Management



















 IT Service Management



 Project Management



 Agile Management



 Web Development



 Cloud Computing


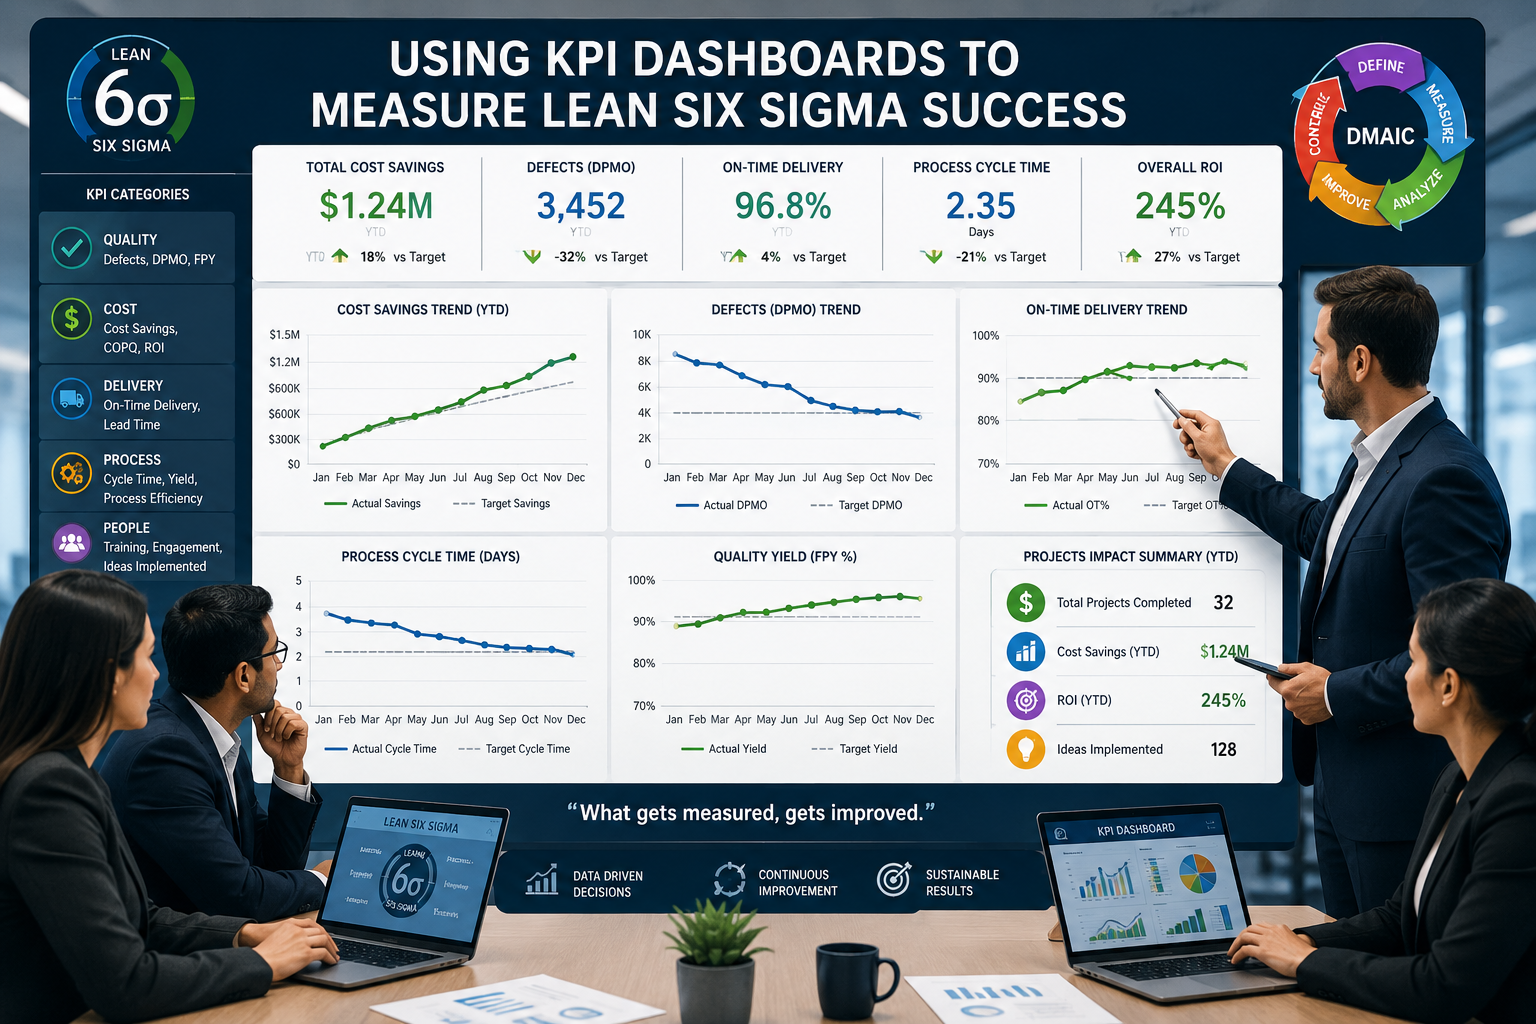
In today’s rapidly evolving business landscape, organizations are continuously searching for ways to improve efficiency, reduce waste, and enhance overall performance. One of the most effective methodologies for achieving operational excellence is Lean Six Sigma. However, measuring the success of Lean Six Sigma initiatives requires well-defined metrics. This is where lean six sigma KPIs and KPI dashboards come into play. In this blog, we will explore how these tools can help businesses in India track their progress and drive continuous improvement.
Understanding Lean Six Sigma KPIs
Before diving into the importance of KPI dashboards, it's essential to understand what lean six sigma KPIs are. Key Performance Indicators (KPIs) are quantifiable measurements that help organizations gauge their performance against defined objectives. In the context of Lean Six Sigma, KPIs focus on process improvement and operational efficiency.
These metrics are crucial for identifying areas that need improvement and for tracking the effectiveness of Lean Six Sigma projects. Common examples of lean six sigma KPIs include:
- Cycle Time
- Defect Rate
- Process Efficiency
- Customer Satisfaction Score
- Cost Savings
The Role of KPI Dashboards in Measuring Success
A KPI dashboard is a visual representation of key metrics that provides a real-time overview of business performance. It allows organizations to track their business performance metrics efficiently and make informed decisions based on data. Here’s how KPI dashboards can enhance the measurement of Lean Six Sigma success:
1. Real-Time Data Visualization
KPI dashboards provide instant access to data, enabling teams to visualize performance metrics at a glance. With real-time updates, organizations can identify trends and issues as they arise, allowing for swift corrective actions. This immediacy is crucial in Lean Six Sigma, where timely interventions can prevent further inefficiencies.
2. Enhanced Decision-Making
Having a centralized dashboard that displays business performance metrics empowers decision-makers to base their strategies on accurate data. This leads to more informed choices regarding process improvements, resource allocation, and project prioritization. In a Lean Six Sigma context, informed decisions can accelerate project timelines and drive better outcomes.
3. Improved Accountability
A KPI dashboard not only tracks performance metrics but also promotes accountability within teams. When team members have clear visibility over their KPIs, they are more likely to take ownership of their tasks and strive to meet or exceed targets. This culture of accountability fosters a collaborative environment where everyone is aligned towards achieving operational excellence.
4. Simplified Reporting
Traditional reporting methods can be time-consuming and may lead to information overload. However, KPI dashboards simplify this process by presenting data in a clear and concise manner. Stakeholders can quickly assess progress towards Lean Six Sigma objectives without sifting through lengthy reports. This efficiency saves time and enhances communication across departments.
5. Continuous Improvement
Lean Six Sigma is all about continuous improvement, and KPI dashboards play a vital role in this journey. By regularly monitoring KPIs, organizations can identify areas that require further optimization. This ongoing assessment ensures that Lean Six Sigma initiatives remain effective and relevant, ultimately leading to sustained operational excellence.
Implementing KPI Dashboards for Lean Six Sigma
To successfully implement KPI dashboards for measuring Lean Six Sigma success, consider the following steps:
1. Define Key Performance Indicators
The first step is to identify the lean six sigma KPIs that align with your organization’s goals. These should be specific, measurable, achievable, relevant, and time-bound (SMART). Collaborate with stakeholders to ensure that the selected KPIs reflect the objectives of your Lean Six Sigma initiatives.
2. Choose the Right Dashboard Tool
Select a KPI dashboard tool that suits your organization’s needs. There are various software options available, ranging from simple spreadsheet-based dashboards to advanced business intelligence platforms. Ensure that the tool you choose can integrate with your existing systems and provide real-time data updates.
3. Design the Dashboard
When designing the dashboard, prioritize clarity and usability. Use visual elements such as graphs, charts, and color coding to make data interpretation easier. Ensure that the key metrics are prominently displayed and that users can drill down for more detailed insights as needed.
4. Train Your Team
Provide training to your team members on how to use the KPI dashboard effectively. Familiarize them with the KPIs being tracked and how to interpret the data. Encourage them to utilize the dashboard in their daily operations and decision-making processes.
5. Monitor and Adjust
Once the dashboard is in place, continuously monitor its effectiveness. Solicit feedback from users and make adjustments as necessary to improve functionality and usability. As your Lean Six Sigma initiatives evolve, be prepared to adapt your KPIs and dashboard design accordingly.
FAQs
What are some common Lean Six Sigma KPIs?
Common lean six sigma KPIs include cycle time, defect rate, process efficiency, customer satisfaction score, and cost savings. These metrics help organizations measure their performance and identify areas for improvement.
How can KPI dashboards improve business performance?
KPI dashboards improve business performance by providing real-time data visualization, enhancing decision-making, promoting accountability, simplifying reporting, and supporting continuous improvement efforts.
What should I consider when choosing a KPI dashboard tool?
When choosing a KPI dashboard tool, consider factors such as ease of use, integration capabilities with existing systems, real-time data updates, and visualization features. Ensure that it aligns with your organization’s specific needs.
Conclusion
Incorporating KPI dashboards into your Lean Six Sigma initiatives can significantly enhance your ability to measure success and drive operational excellence. By leveraging real-time data and visual insights, organizations can make informed decisions that lead to continuous improvement. As you embark on your journey to optimize business performance, remember that the right metrics and tools can make all the difference.
Are you ready to take your Lean Six Sigma initiatives to the next level? Start implementing KPI dashboards today and witness the transformation in your operations. For more insights and expert guidance, contact us!


Leave a Comment