
 Quality Management



















 IT Service Management



 Project Management



 Agile Management



 Web Development



 Cloud Computing


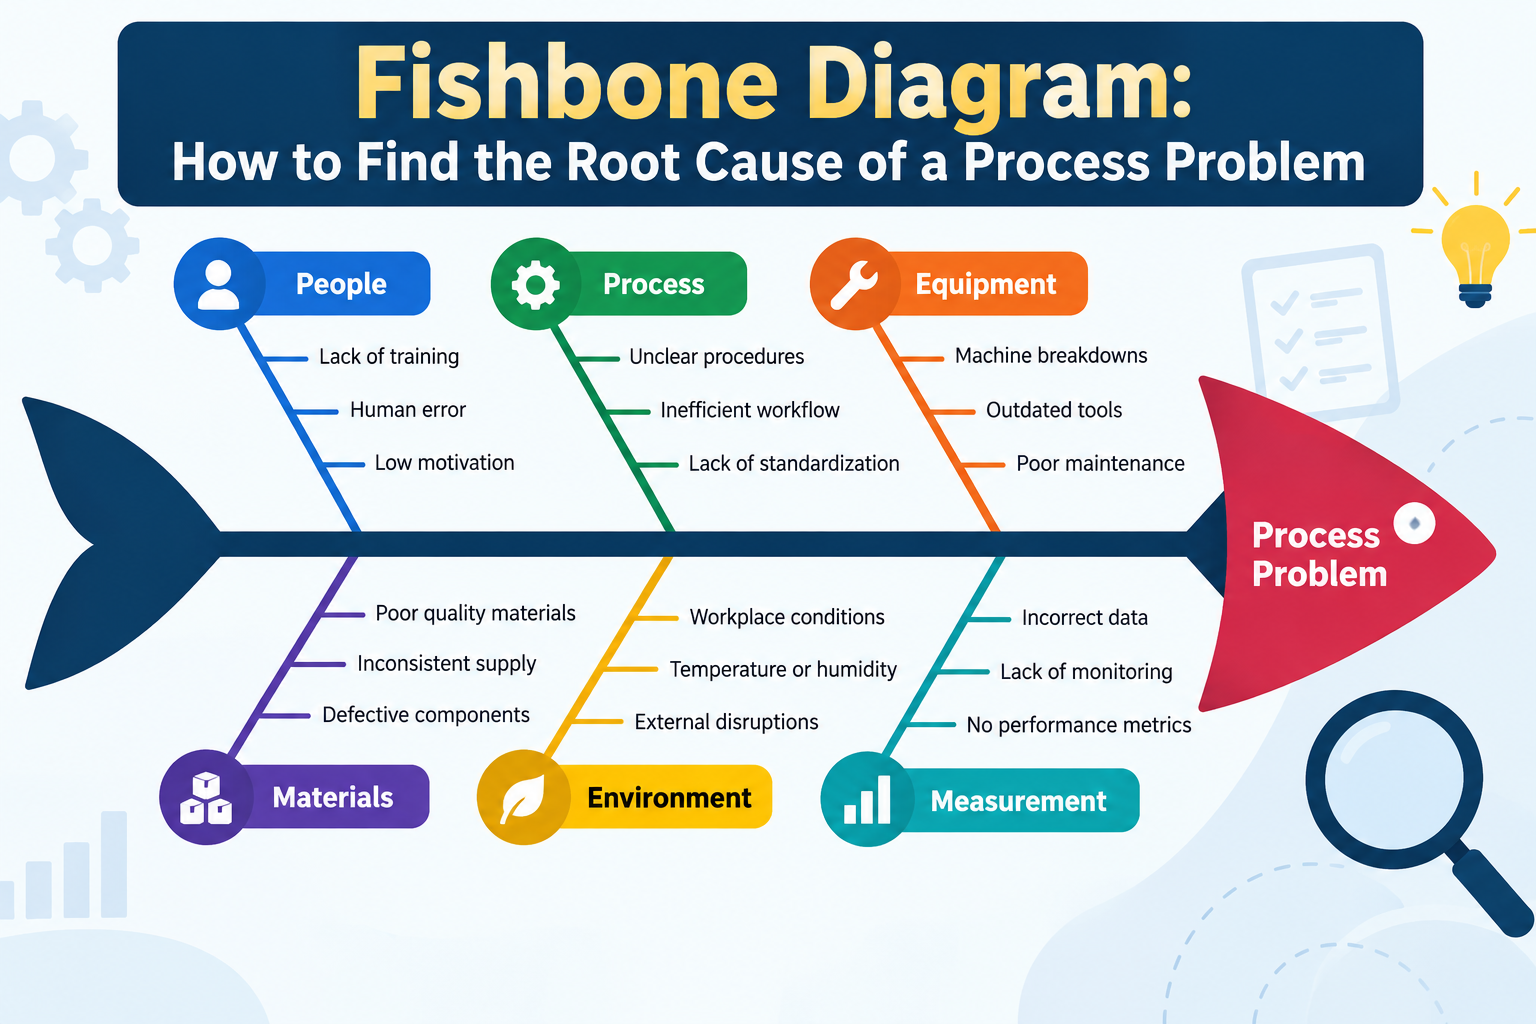
In the fast-paced world of business, identifying and solving problems efficiently can make a significant difference in productivity and profitability. One of the most effective tools for this purpose is the fishbone diagram, also known as the Ishikawa diagram or cause-and-effect diagram. This visual tool aids teams in identifying the root causes of issues, enabling them to implement effective solutions. In this blog post, we will explore what a fishbone diagram is, how to create one, and its application in various industries, particularly in the Indian context.
What is a Fishbone Diagram?
A fishbone diagram is a visual representation that helps teams systematically identify and analyze the potential causes of a specific problem. The diagram resembles the skeleton of a fish, where the head represents the main problem, and the bones represent the various categories of causes contributing to that problem. This tool is particularly useful for quality management and process improvement initiatives.
The Structure of a Fishbone Diagram
The basic structure of a fishbone diagram includes:
- Head: This is where the main problem or effect is stated.
- Spine: A straight line that leads to the head, representing the main cause of the problem.
- Bones: These branch off the spine and represent categories of causes, which can include people, processes, materials, machines, measurements, and environment.
Why Use a Fishbone Diagram?
The fishbone diagram is an essential tool for several reasons:
- Visual Clarity: It provides a clear visual representation, making it easy for teams to understand complex problems.
- Collaborative Effort: It encourages teamwork and collaboration as team members discuss various potential causes.
- Root Cause Focus: By identifying root causes, teams can implement long-term solutions rather than temporary fixes.
- Versatility: It can be applied across various industries, from manufacturing to healthcare and beyond.
How to Create a Fishbone Diagram
Creating a fishbone diagram is a straightforward process. Follow these steps to construct one effectively:
Step 1: Define the Problem
Clearly define the problem you want to analyze. Write it down at the head of the diagram. For instance, if you are facing delays in project delivery, state it as the main issue.
Step 2: Identify Categories of Causes
Identify the main categories that could contribute to the problem. Common categories include:
- People: Issues related to human resources or team performance.
- Processes: Inefficiencies in workflow or procedures.
- Materials: Quality or availability of materials used.
- Machines: Equipment malfunction or inadequacy.
- Measurements: Data collection errors or inadequate metrics.
- Environment: External factors that could impact the process.
Step 3: Brainstorm Causes
Gather your team and brainstorm potential causes related to each category. Encourage open discussion to uncover all possible factors. Write these down as smaller bones branching off the main categories.
Step 4: Analyze and Prioritize Causes
After identifying potential causes, analyze them to determine which are the most likely contributors to the problem. You can use techniques like the Pareto principle (80/20 rule) to prioritize the causes that will have the most significant impact if addressed.
Step 5: Develop Action Plans
Once you have identified the root causes, create an action plan to address them. Assign responsibilities, set deadlines, and determine the necessary resources for implementation.
Applications of Fishbone Diagrams in India
In India, the fishbone diagram is becoming increasingly popular across various sectors:
Manufacturing
In the manufacturing industry, fishbone diagrams help teams identify inefficiencies, reduce waste, and improve production processes. By addressing root causes, manufacturers can enhance overall quality and operational efficiency.
Healthcare
In healthcare, fishbone diagrams assist in identifying the causes of patient care issues, medication errors, or operational inefficiencies. This tool can lead to improved patient outcomes and streamlined processes.
Education
Educational institutions can benefit from fishbone diagrams by analyzing factors affecting student performance, curriculum effectiveness, and resource allocation. By pinpointing root causes, schools can implement targeted improvements.
Frequently Asked Questions (FAQs)
1. What is the main purpose of a fishbone diagram?
The primary purpose of a fishbone diagram is to identify and analyze the root causes of a specific problem, facilitating effective problem-solving and decision-making.
2. Can I use a fishbone diagram for any type of problem?
Yes, a fishbone diagram can be applied to a wide range of problems across various industries, making it a versatile tool for root cause analysis.
3. How do I ensure effective brainstorming during the process?
Encourage open communication among team members, create a safe space for sharing ideas, and use techniques like mind mapping to foster creativity during brainstorming sessions.
4. Are there any software tools available for creating fishbone diagrams?
Yes, several software tools and online platforms can help you create fishbone diagrams, including Lucidchart, Creately, and Microsoft Visio.
5. How can I measure the effectiveness of solutions implemented after using a fishbone diagram?
To measure effectiveness, establish key performance indicators (KPIs) related to the identified problem. Monitor these metrics over time to assess improvements resulting from your solutions.
Conclusion
The fishbone diagram is a powerful tool that can significantly enhance your problem-solving capabilities. By identifying root causes, teams can implement lasting solutions that improve processes and drive efficiency. Whether you are in manufacturing, healthcare, education, or any other industry, this tool can provide valuable insights into your operations. Start utilizing fishbone diagrams today to streamline your processes and overcome challenges effectively.
Call to Action
If you found this blog helpful and want to learn more about effective problem-solving techniques, subscribe to our newsletter for the latest insights and tips. Share your experiences with fishbone diagrams in the comments below, and let’s continue the conversation on improving processes together!



Leave a Comment