
 Quality Management



















 IT Service Management



 Project Management



 Agile Management



 Web Development



 Cloud Computing


In today's fast-paced manufacturing and service industries, maintaining quality control is paramount. One of the most effective tools for ensuring that processes remain stable and predictable is the control chart. This blog will delve deeper into understanding control charts, their significance, and how to effectively utilize them to monitor processes. Whether you’re in manufacturing, healthcare, or any other sector, grasping this concept can significantly enhance your operations.
What is a Control Chart?
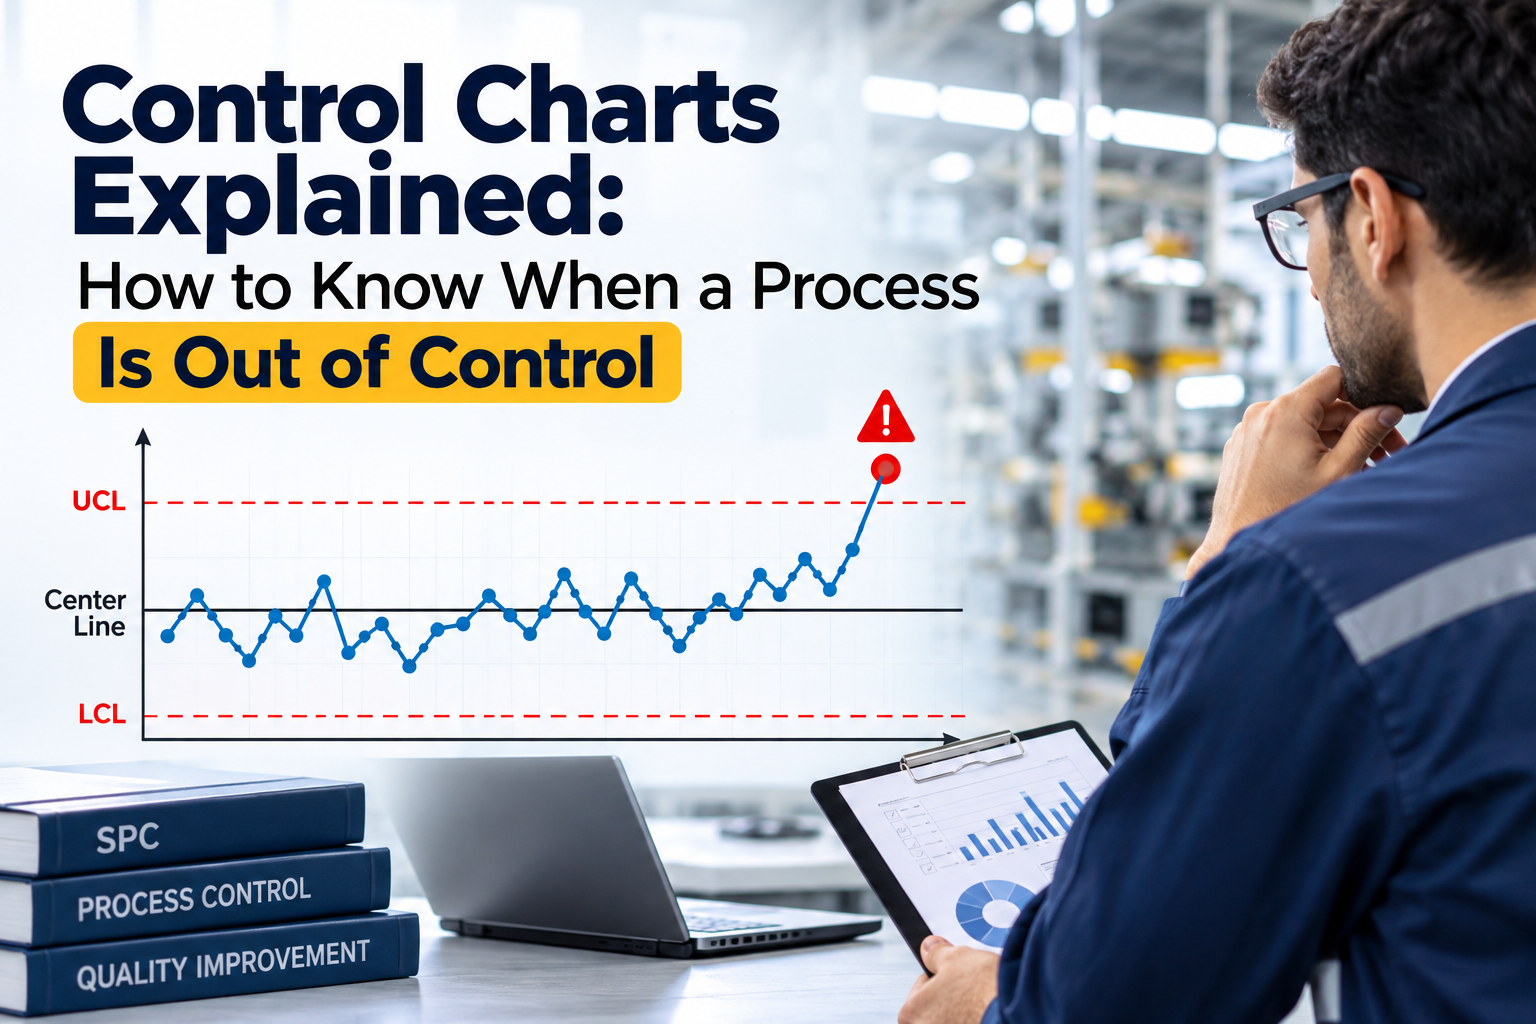
A control chart is a statistical tool used to monitor the stability of a process over time. It helps in understanding variations in the process, whether they are due to natural fluctuations or specific assignable causes. By plotting data points over time and analyzing their trends, control charts enable organizations to identify when a process is out of control.
Control charts are widely used in Six Sigma and Total Quality Management (TQM) initiatives, making them a vital tool for any business aiming for excellence. In India, where the manufacturing sector is continually evolving, understanding and implementing control charts can lead to significant improvements in quality and efficiency.
The Components of Control Charts
To effectively utilize a control chart, it's essential to understand its components:
- Center Line (CL): This line represents the average or mean of the data points and serves as a reference point.
- Upper Control Limit (UCL): This line indicates the maximum acceptable variation in a process. If data points cross this line, it suggests that the process may be out of control.
- Lower Control Limit (LCL): Similar to UCL, this line indicates the minimum acceptable variation. Points below this line indicate potential issues.
- Data Points: These represent the actual measurements or observations plotted over time.
Types of Control Charts
There are several types of control charts, each suited for different types of data:
- Variable Control Charts: Used for data that can be measured on a continuous scale (e.g., weight, temperature). Common examples include X-bar and R charts.
- Attribute Control Charts: Used for categorical data that can be counted (e.g., number of defects). Examples include p-charts and np-charts.
Why Use Control Charts?
Control charts provide numerous benefits for organizations looking to improve their processes:
- Real-Time Monitoring: They allow for continuous oversight of processes, helping to detect issues as they arise.
- Data-Driven Decisions: Control charts provide objective data, enabling informed decision-making regarding process adjustments.
- Identify Trends: Long-term use of control charts helps identify trends and patterns, making it easier to predict future performance.
- Reduce Waste: By catching issues early, organizations can minimize waste and reduce costs associated with rework or defective products.
How to Create a Control Chart
Creating a control chart may seem daunting, but it can be simplified into a few key steps:
Step 1: Collect Data
Gather data from the process you want to monitor. Ensure that the data is collected consistently to maintain accuracy.
Step 2: Calculate the Average
Determine the mean of your data set, which will serve as the center line.
Step 3: Calculate Control Limits
Using statistical formulas, calculate the UCL and LCL. For variable control charts, this often involves standard deviation.
Step 4: Plot the Data
Using graph paper or software, plot your data points against time, indicating the CL, UCL, and LCL.
Step 5: Analyze the Chart
Look for patterns or trends in your data. Are there points outside the control limits? Is there a non-random pattern? These indicate that the process may be out of control.
When Is a Process Considered Out of Control?
A process is deemed to be out of control in several scenarios:
- Data points fall outside of the UCL or LCL.
- A run of seven or more points occurs in one direction (upward or downward).
- There are sudden spikes or drops in the data points.
- Patterns, such as cycles or trends, are observed.
Common Mistakes to Avoid
While implementing control charts, avoid these common pitfalls:
- Ignoring the Context: Always consider the context of the data and the process when analyzing control charts.
- Failing to Update Control Limits: Control limits should be recalibrated as processes improve or change.
- Overreacting to Minor Variations: Not every variation indicates a problem; focus on significant trends.
FAQs about Control Charts
What industries commonly use control charts?
Control charts are widely used across many industries including manufacturing, healthcare, finance, and service industries. Any sector that values quality control can benefit from them.
How can I learn more about control charts?
Many online courses, workshops, and books are available that focus on statistical process control (SPC) and control charts. Additionally, organizations like ASQ (American Society for Quality) offer resources and certifications.
Can control charts be used for non-manufacturing processes?
Absolutely! Control charts are applicable in various sectors beyond manufacturing, including service industries, healthcare, and even project management.
Conclusion
In conclusion, utilizing a control chart is essential for any organization aiming to monitor and improve its processes. By understanding the components, types, and benefits of control charts, you can make data-driven decisions that enhance the stability and quality of your operations.
If you’re looking to implement control charts in your organization, consider reaching out to quality management consultants or enrolling in training sessions to deepen your understanding and skills. Remember, the key to success lies in continuous improvement, and control charts are a powerful tool to help you achieve that.
Ready to take control of your processes? Contact us today to learn how control charts can transform your operations!


Leave a Comment