
 Quality Management



















 IT Service Management



 Project Management



 Agile Management



 Web Development



 Cloud Computing


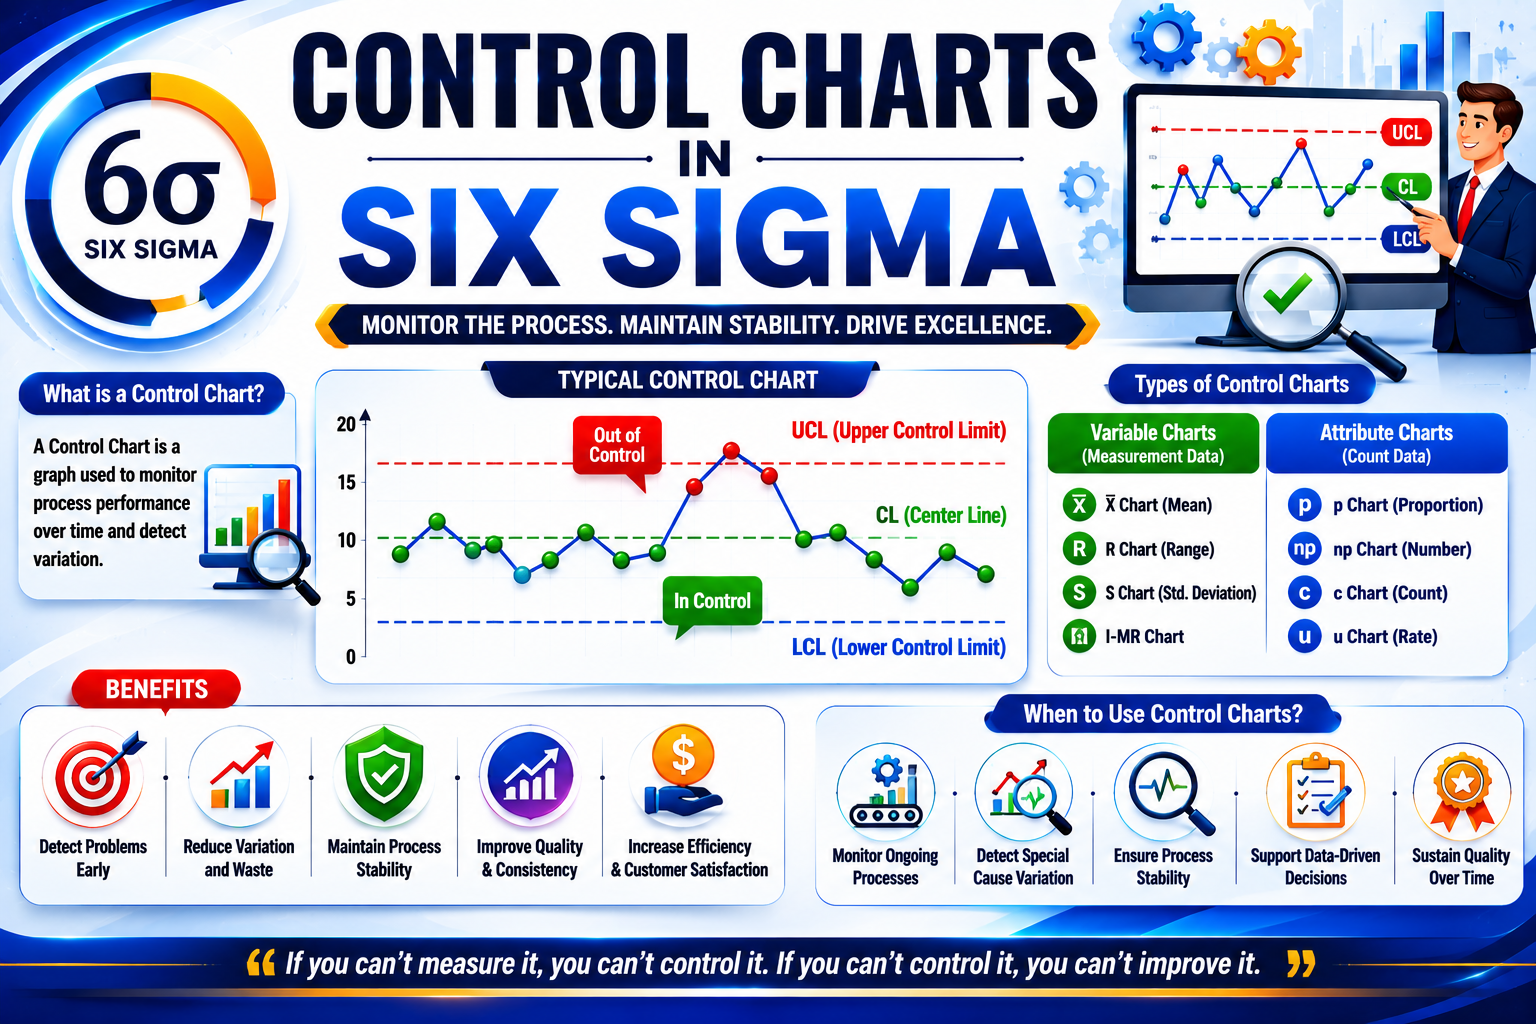
In the world of quality management and process improvement, Six Sigma has carved a niche for itself. One of the essential tools within this methodology is the control chart. This blog aims to delve deep into the concept of control charts, their significance in statistical process control (SPC), and how they can be effectively utilized during the control phase of Six Sigma projects.
What Are Control Charts?
A control chart is a statistical tool used to monitor the stability of a process over time. It helps in distinguishing between common cause variations (inherent to the process) and special cause variations (due to external factors). By plotting data points in a time-ordered sequence, control charts allow teams to visualize the performance of a process and identify any deviations that may require intervention.
The Importance of Control Charts in Quality Management
Control charts are vital in quality management for several reasons:
- Real-time Monitoring: Control charts provide a real-time view of a process, allowing teams to detect issues as they arise.
- Data-Driven Decisions: They facilitate informed decision-making by relying on statistical data rather than intuition.
- Continuous Improvement: Control charts support the continuous improvement mindset by highlighting areas needing attention.
Types of Control Charts
There are various types of control charts, each serving a distinct purpose. Here are the most commonly used ones:
1. X-bar and R Chart
The X-bar and R chart is used for monitoring the mean and range of a process when data is collected in subgroups. It’s particularly useful for assessing the stability of processes over time.
2. P Chart
The P chart is applicable for quality characteristics that are attributes (e.g., pass/fail). It helps monitor the proportion of defective items in a process.
3. C Chart
The C chart is used for count data, specifically to monitor the number of defects in a fixed sample size. It’s invaluable for processes where defects can occur multiple times.
4. U Chart
The U chart is similar to the C chart but is more versatile as it deals with varying sample sizes. It monitors the average number of defects per unit.
How Control Charts Fit into Statistical Process Control (SPC)
Statistical process control employs statistical methods to monitor and control a process. Control charts are a critical component of SPC as they visually represent process performance over time. By utilizing control charts, organizations can:
- Identify trends and patterns in data.
- Take proactive measures before issues escalate.
- Improve overall process performance and quality.
Implementing Control Charts in the Control Phase of Six Sigma
The control phase of Six Sigma is crucial as it ensures that improvements are sustained over time. Here’s how control charts play a role in this phase:
1. Establishing Control Limits
Control limits are calculated based on historical data and are used to determine the expected range of variation in a process. By setting these limits, teams can identify when a process is going out of control.
2. Routine Monitoring
Regularly updating control charts with new data allows organizations to monitor process stability. This routine oversight helps in catching deviations early, thereby maintaining quality standards.
3. Training and Awareness
Educating team members about reading and interpreting control charts fosters a culture of quality and encourages proactive engagement in maintaining process stability.
Benefits of Using Control Charts in Six Sigma Projects
Incorporating control charts into Six Sigma projects yields numerous benefits:
- Improved Quality: By monitoring processes closely, organizations can ensure that quality remains high.
- Reduced Costs: Early detection of issues can prevent costly rework and defects.
- Empowered Employees: Employees equipped with the knowledge of control charts can contribute more effectively to quality improvement initiatives.
Challenges in Using Control Charts
While control charts are powerful tools, there are challenges to consider:
- Data Quality: The reliability of control charts hinges on the quality of the data being used. Poor data can lead to misleading conclusions.
- Complexity: Some team members may find it challenging to understand and interpret control charts, necessitating proper training.
- Resistance to Change: Organizational culture can impede the adoption of statistical tools, requiring strong leadership to drive change.
Real-World Applications of Control Charts in India
Control charts have been successfully implemented across various industries in India, demonstrating their versatility:
Manufacturing
In the manufacturing sector, control charts are used to monitor production processes, ensuring that product quality remains consistent. For instance, a textile manufacturer may use an X-bar and R chart to monitor thread tension.
Healthcare
Hospitals employ control charts to track patient wait times and treatment outcomes. By analyzing this data, they can improve operational efficiency and patient care.
Food Industry
Food processing companies utilize control charts to monitor critical control points within their processes, ensuring compliance with safety standards and enhancing product quality.
Frequently Asked Questions (FAQs)
1. What is the primary purpose of a control chart?
The primary purpose of a control chart is to monitor process stability and identify variations that may indicate potential quality issues.
2. How do I choose the right control chart for my process?
The choice of control chart depends on the type of data you have (continuous vs. attribute) and the specific quality characteristics you wish to monitor.
3. Can control charts predict future performance?
While control charts cannot predict future performance, they can identify trends that may suggest future issues, allowing for proactive interventions.
4. How often should control charts be updated?
Control charts should be updated regularly, ideally as new data becomes available, to ensure ongoing monitoring of the process.
Conclusion
Control charts are indispensable tools in the Six Sigma toolkit, contributing significantly to quality management and process improvement. By effectively implementing control charts during the control phase of Six Sigma, organizations can ensure sustained improvements, reduced costs, and enhanced product quality.
For Indian businesses aiming to elevate their quality management practices, incorporating control charts into their SPC strategies is a step towards achieving operational excellence. Start leveraging control charts today to take your processes to the next level!
Call to Action
Ready to implement control charts in your organization? Contact us today for expert guidance on integrating statistical process control into your Six Sigma initiatives!




Leave a Comment