
 Quality Management



















 IT Service Management



 Project Management



 Agile Management




 Web Development



 Cloud Computing


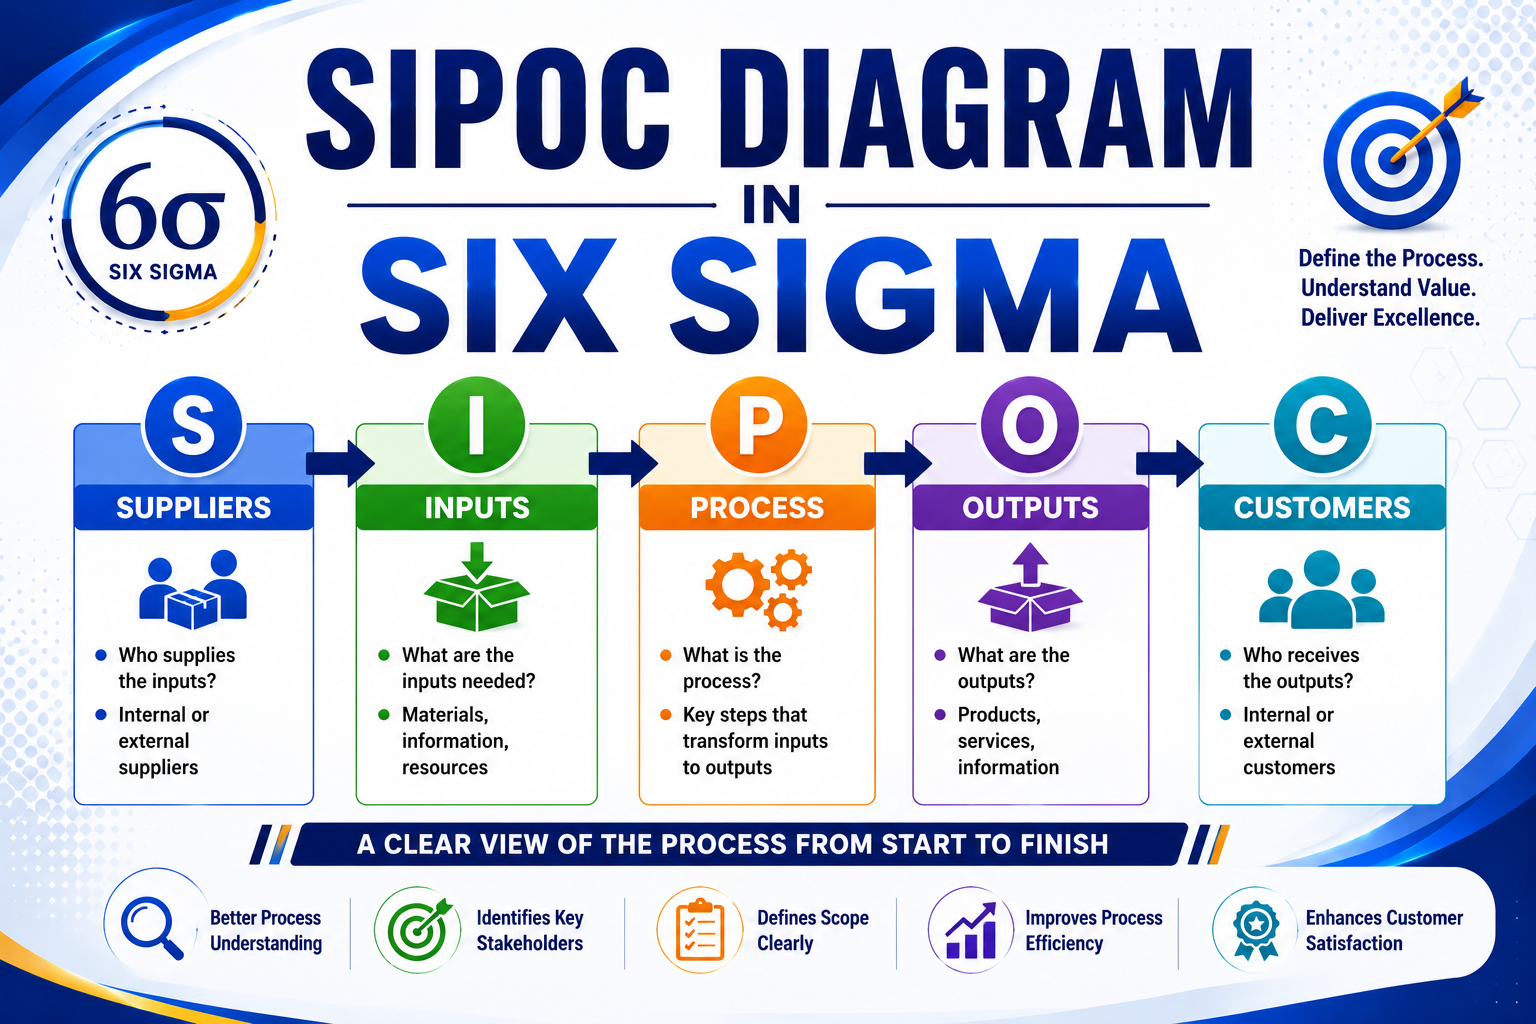
In today's fast-paced business landscape, organizations continually seek methods to enhance efficiency and streamline processes. One such powerful tool is the sipoc diagram, a critical component of Six Sigma methodology. This blog will explore the sipoc model, detailing its components, applications, and providing relatable sipoc examples to illustrate its effectiveness.
What is a SIPOC Diagram?
The SIPOC diagram is a high-level visual tool that summarizes the inputs and outputs of a process. The acronym SIPOC stands for:
- Supplier
- Input
- Process
- Output
- Customer
Designed to provide a clear overview, the SIPOC diagram helps teams understand the relationships between suppliers, the inputs they provide, the processes that transform these inputs, the outputs generated, and the customers who receive these outputs. This overview is essential for identifying improvement opportunities in any process.
Why Use a SIPOC Diagram?
There are several compelling reasons to incorporate a sipoc diagram into your process improvement efforts:
- Clarity: By mapping out the entire process, teams can visualize how each component interacts. This clarity can lead to better communication among team members.
- Focus on Key Elements: The SIPOC diagram emphasizes the most critical elements of a process, ensuring that attention is directed where it is most needed.
- Problem-Solving: Identifying bottlenecks or areas for improvement becomes easier when the entire workflow is laid out clearly.
- Stakeholder Engagement: A SIPOC diagram can facilitate discussions with stakeholders, helping them understand the process and their role in it.
Components of the SIPOC Diagram
Let's break down the components of the SIPOC diagram further:
1. Supplier
Suppliers are entities that provide the necessary inputs for the process. In an Indian context, this could range from local vendors to international suppliers, depending on the industry. For example, in the manufacturing sector, suppliers may provide raw materials, while in the IT sector, they could supply software or hardware components.
2. Input
Inputs are the resources, materials, or information required to execute a process. Understanding the inputs is crucial, as they directly affect the quality of the output. For instance, in a food manufacturing plant, inputs would include raw ingredients, packaging materials, and labor.
3. Process
The process is the series of actions taken to transform inputs into outputs. This is where the actual work happens. In a typical Indian manufacturing firm, this could involve assembly lines, quality checks, and packaging processes.
4. Output
Outputs are the final products or services resulting from the process. These should meet specific quality standards to satisfy customer needs. For instance, in a software company, the output could be a mobile application or a software solution delivered to the client.
5. Customer
Customers are the end-users or recipients of the outputs. They can be internal (within the organization) or external (clients and consumers). Understanding customer needs is vital for ensuring that the outputs are valuable and meet expectations.
Creating a SIPOC Diagram
Creating a SIPOC diagram involves several straightforward steps:
- Identify the Process: Start by defining the process you want to analyze. Be specific, as a well-defined process is easier to map.
- List the Suppliers: Identify who supplies the inputs for your process. This includes both internal and external suppliers.
- Detail the Inputs: List all the necessary inputs required to carry out the process. Be thorough to ensure no critical input is overlooked.
- Outline the Process Steps: Break down the process into manageable steps. Aim for a high-level overview that captures the essence without getting bogged down in details.
- Define the Outputs: Clearly state what the process produces. Ensure that these outputs align with customer needs.
- Identify the Customers: Finally, identify who receives the outputs. Understanding your customers is key to delivering value.
SIPOC Example
To make the concept clearer, let’s look at a sipoc example in the context of an Indian e-commerce business:
Example: E-commerce Order Fulfillment Process
- Supplier: Vendors and suppliers of products, logistics companies.
- Input: Product inventory, customer order details, payment information.
- Process:
- Receive customer order
- Verify payment
- Pick products from inventory
- Pack products for shipping
- Dispatch products via logistics partner
- Output: Packaged product ready for shipment.
- Customer: End consumers who placed the order.
This example illustrates how the SIPOC diagram helps in visualizing the entire order fulfillment process, enabling the e-commerce business to identify potential bottlenecks and streamline operations effectively.
Benefits of Using SIPOC in Six Sigma
The SIPOC diagram is a valuable tool in Six Sigma projects for several reasons:
- Standardization: It helps standardize processes, ensuring that everyone on the team understands the workflow.
- Improved Quality: By focusing on inputs and outputs, organizations can enhance product quality and customer satisfaction.
- Facilitates Training: New employees can quickly learn the processes through a SIPOC diagram, reducing the learning curve.
- Enhanced Collaboration: Encourages cross-functional collaboration by engaging different departments in the process.
FAQs about SIPOC Diagrams
1. What industries can benefit from a SIPOC diagram?
Almost any industry can benefit from a SIPOC diagram, including manufacturing, service, healthcare, finance, and IT. Its versatility makes it a valuable tool for process improvement across various sectors.
2. Is a SIPOC diagram the same as a flowchart?
No, while both tools visualize processes, a SIPOC diagram focuses on high-level components (suppliers, inputs, processes, outputs, customers), whereas a flowchart provides a detailed step-by-step representation of a process.
3. How often should a SIPOC diagram be updated?
A SIPOC diagram should be updated whenever significant changes occur in the process, such as changes in suppliers, inputs, or customer requirements. Regular reviews can help maintain its relevance.
4. Can I create a SIPOC diagram using software?
Yes, many software tools and templates are available to create SIPOC diagrams easily. Tools like Microsoft Visio, Lucidchart, or even PowerPoint can help you design an effective SIPOC diagram.
Conclusion
Incorporating a sipoc diagram into your Six Sigma toolkit can significantly enhance your process improvement initiatives. By providing a clear overview of suppliers, inputs, processes, outputs, and customers, the SIPOC model empowers organizations to identify areas for improvement and streamline operations effectively.
Are you ready to implement the SIPOC diagram in your organization? Start today and unlock the potential for enhanced efficiency and improved quality in your processes!
If you have any questions or need assistance, feel free to reach out! Your journey towards process excellence begins now.




Leave a Comment