Root Cause Analysis (RCA) is a critical process in problem-solving within various industries. While many are familiar with the Fishbone Diagram, also known as the Ishikawa Diagram, there are numerous advanced RCA methods that can provide deeper insights and more effective solutions. In this blog, we will explore various advanced RCA methods and root cause analysis tools that go beyond the traditional approaches, particularly focusing on their relevance in the Indian context.
Understanding Root Cause Analysis
Root Cause Analysis is a systematic approach used to identify the underlying causes of problems or defects. It aims to determine what happened, why it happened, and how to prevent it from happening again. In a rapidly evolving marketplace like India, businesses must adopt advanced RCA methods to stay competitive and ensure operational excellence.
The Importance of Advanced RCA Techniques
While the Fishbone Diagram is useful for many scenarios, it may not always provide a comprehensive view of complex issues. Advanced RCA methods offer more robust frameworks and tools that can lead to better decision-making and enhanced problem-solving capabilities. By utilizing these techniques, organizations can improve their processes, reduce waste, and enhance customer satisfaction.
Advanced RCA Methods
1. 5 Whys Technique
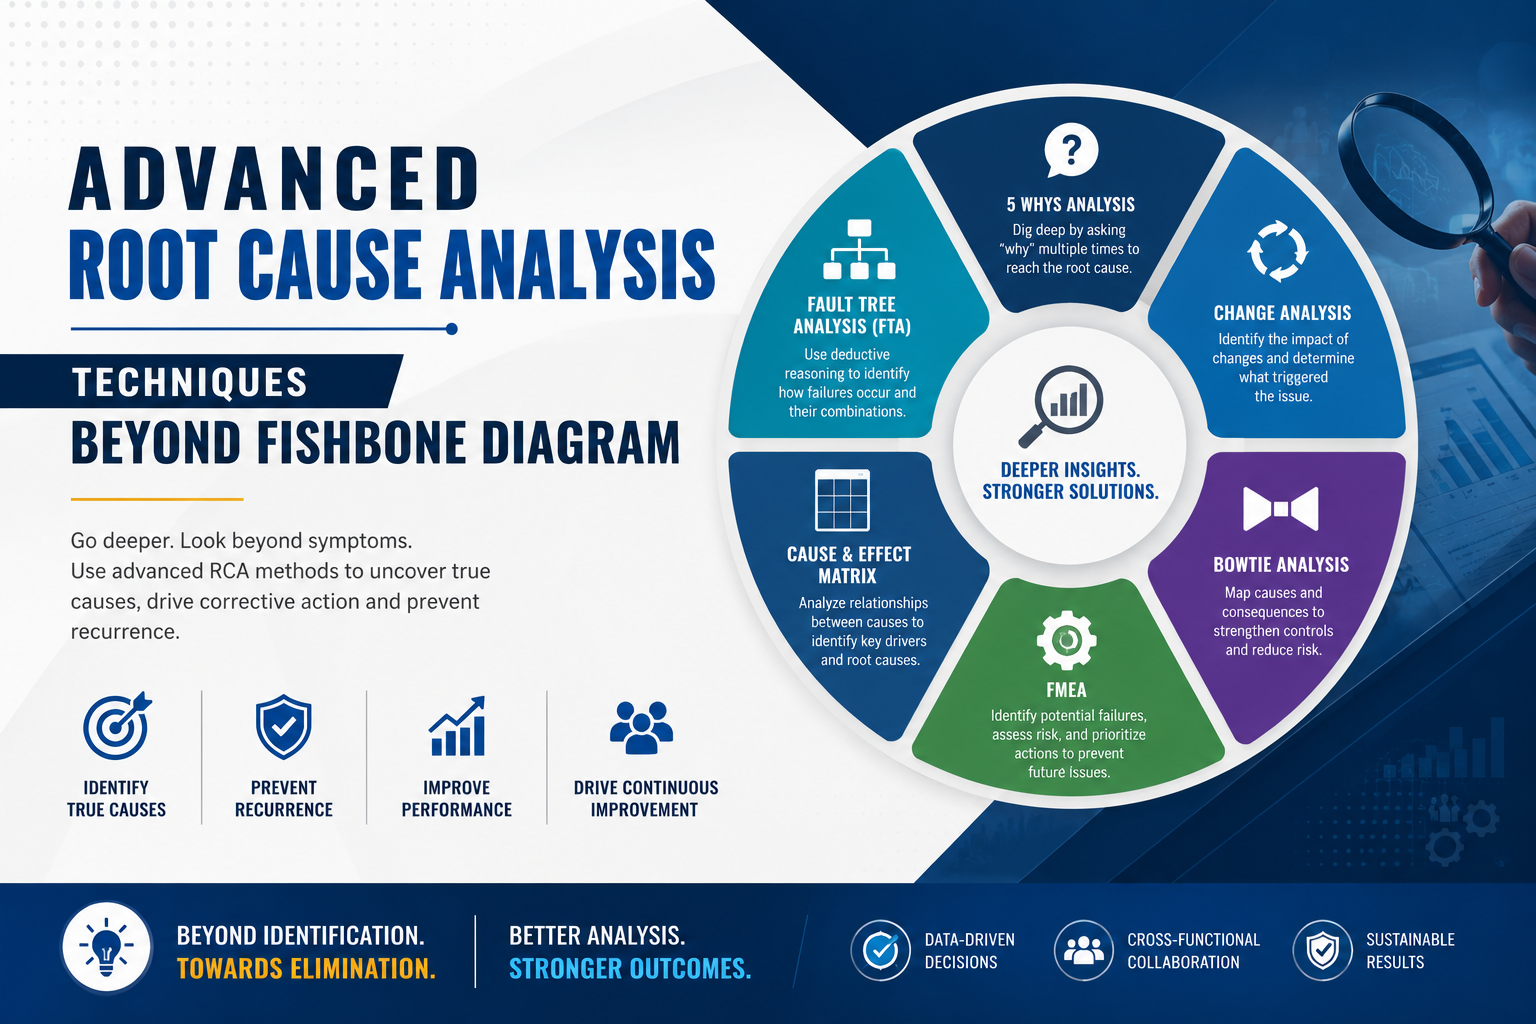
The 5 Whys Technique is a simple yet powerful tool that involves asking "why" multiple times—typically five—to drill down to the root cause of a problem. This method encourages teams to delve deeper into issues rather than settling for surface-level explanations. In the Indian manufacturing sector, for instance, a production delay could be traced back through multiple layers using this technique, ultimately revealing systemic inefficiencies.
2. Pareto Analysis
Based on the Pareto Principle (80/20 rule), Pareto Analysis helps identify the most significant factors affecting a problem. By focusing on the 20% of causes that lead to 80% of the effects, organizations can prioritize their efforts and resources effectively. This method is particularly useful in sectors like retail and service in India, where small changes can lead to substantial improvements in customer satisfaction.
3. Failure Mode and Effects Analysis (FMEA)
FMEA is a proactive approach that identifies potential failure modes within a process and assesses their impact. This technique is commonly used in industries such as healthcare and automotive in India, where understanding risks and their implications can save lives and costs. By analyzing the likelihood and severity of failures, teams can implement preventative measures before issues arise.
4. Root Cause Tree Analysis
Root Cause Tree Analysis involves creating a visual representation of the problem and its potential root causes. This method allows teams to systematically explore various branches of problems, leading to a clearer understanding of the issue. In fields like construction and engineering, where complex interdependencies exist, this method can help identify critical areas for intervention.
5. Scatter Diagrams
A Scatter Diagram is a graphical tool used to determine the relationship between two variables. By plotting data points, organizations can visualize correlations that may indicate root causes. In the Indian IT sector, for instance, scatter diagrams can help identify relationships between software bugs and specific coding practices, leading to improved quality control.
6. Brainstorming Sessions
While not a formal method, structured brainstorming sessions can generate a wealth of information regarding potential root causes. By bringing together cross-functional teams, organizations can leverage diverse perspectives and experiences. This collaborative approach is particularly beneficial in India’s diverse corporate landscape, where varied insights can lead to innovative solutions.
Root Cause Analysis Tools
1. RCA Software Solutions
Various software tools are available that facilitate efficient root cause analysis. These tools often integrate advanced analytics, data visualization, and collaboration features. Some popular RCA software options include:
- TapRooT: A comprehensive RCA tool that guides users through the RCA process with templates and best practices.
- RCA2: This software offers a structured approach to RCA, making it easier for teams to document findings and track corrective actions.
- SmartDraw: A versatile diagramming tool that can be used to create fishbone diagrams, flowcharts, and other visual aids for RCA.
2. Data Analysis Tools
Data analysis tools like Excel, Minitab, and R can be pivotal in uncovering patterns and trends that lead to root causes. These tools allow teams to conduct statistical analyses and visualize data, which enhances the RCA process. In the context of Indian businesses, harnessing data analytics can significantly improve operational efficiency and decision-making.
3. Collaboration Platforms
Platforms like Microsoft Teams, Slack, and Trello can facilitate communication and collaboration during the RCA process. These tools allow teams to share findings, discuss potential causes, and track progress on corrective actions. Given the geographical diversity in India, leveraging collaboration platforms can ensure that all team members are engaged and informed throughout the RCA process.
Implementing Advanced RCA Techniques in Your Organization
To effectively integrate advanced RCA methods and tools into your organization, consider the following steps:
- Training and Development: Invest in training programs for employees to familiarize them with advanced RCA techniques and tools.
- Encourage a Culture of Continuous Improvement: Foster an environment where employees feel empowered to identify problems and propose solutions.
- Utilize Technology: Implement software and data analysis tools that streamline the RCA process and enhance collaboration.
- Monitor and Measure Results: Regularly assess the effectiveness of RCA efforts and make adjustments as necessary to improve outcomes.
FAQs
What is the Fishbone Diagram, and how does it differ from advanced RCA methods?
The Fishbone Diagram, or Ishikawa Diagram, is a visual tool used to identify potential causes of a problem. While it is effective for simple issues, advanced RCA methods delve deeper into complex problems, often using data analysis and systematic approaches to uncover root causes.
How can advanced RCA methods benefit Indian businesses?
Advanced RCA methods can help Indian businesses improve operational efficiency, reduce costs, enhance product quality, and boost customer satisfaction. By identifying and addressing root causes, organizations can implement effective solutions that lead to long-term success.
Are there specific industries in India that can benefit more from advanced RCA techniques?
Yes, industries such as manufacturing, healthcare, IT, and construction can significantly benefit from advanced RCA techniques. These sectors often deal with complex processes and systems, making it crucial to identify root causes accurately to prevent recurring issues.
Conclusion
In today’s competitive landscape, adopting advanced RCA methods and utilizing effective root cause analysis tools is essential for organizations in India. By going beyond traditional approaches like the Fishbone Diagram, businesses can uncover deeper insights, leading to innovative solutions and continuous improvement. Are you ready to elevate your problem-solving capabilities? Start implementing these advanced RCA techniques in your organization today!
Call to Action
If you found this blog helpful, please share it with your colleagues and friends. For more insights on advanced RCA methods and tools, subscribe to our newsletter and stay updated on the latest trends and best practices tailored for Indian businesses!


Leave a Comment