Six Sigma is a powerful methodology that helps organizations improve their processes by identifying and eliminating defects. One of the key phases in the Six Sigma process is the Analysis Phase, where data is scrutinized to identify root causes of problems. In this blog, we will explore the Top 5 Tools of Six Sigma in Analysis Phase and provide insights on how to use these tools effectively.
Understanding the Analysis Phase in Six Sigma
Before delving into the tools, it’s essential to understand what the Analysis Phase entails. This phase follows the Define and Measure phases and is crucial for making informed decisions based on data. The primary goal is to analyze the data collected in the Measure phase to identify the factors contributing to the problem.
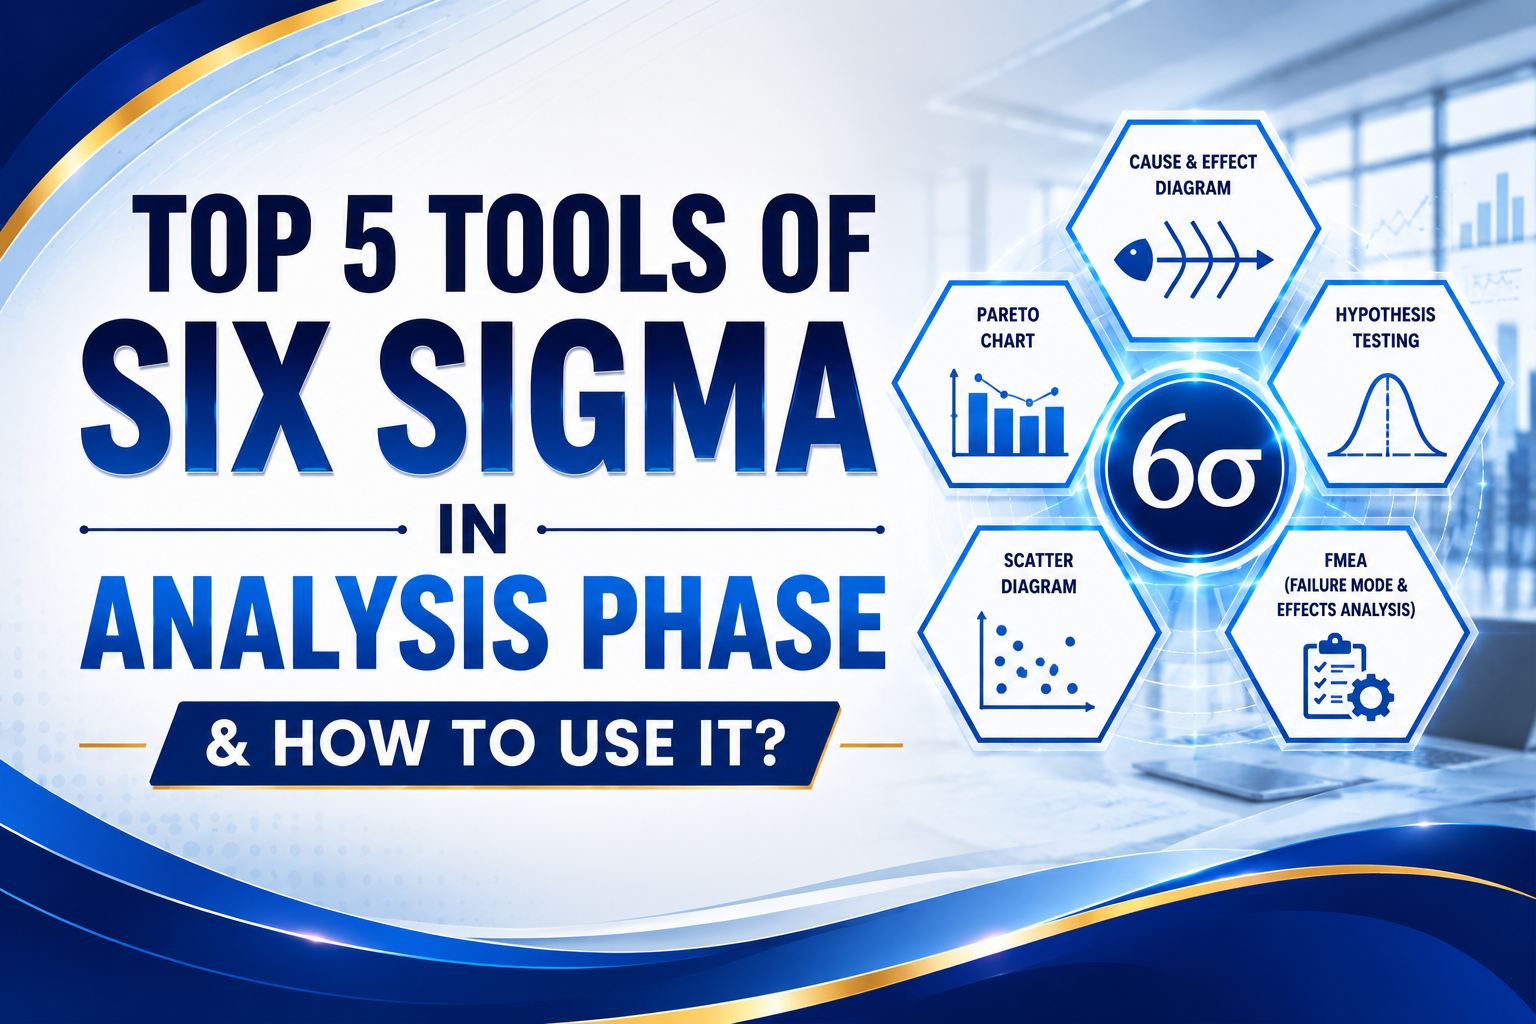
Top 5 Tools of Six Sigma in Analysis Phase
1. Pareto Chart
The Pareto Chart is a visual tool that helps identify the most significant factors contributing to a problem. Named after the Pareto Principle (80/20 rule), it allows you to focus on the vital few rather than the trivial many.
How to use the Pareto Chart:
- Collect data on defects or issues.
- Organize the data in descending order of frequency.
- Create a bar chart with the frequency on the vertical axis and categories on the horizontal axis.
- Overlay a cumulative percentage line to visualize the impact of each category.
2. Fishbone Diagram (Ishikawa Diagram)
The Fishbone Diagram is a brainstorming tool that helps teams identify potential causes of a problem. It encourages group collaboration and ensures that all potential contributing factors are considered.
How to use the Fishbone Diagram:
- Clearly define the problem statement.
- Draw a horizontal line (the spine) and write the problem at the head.
- Identify major categories of causes (e.g., People, Process, Machines) and draw diagonal lines (bones) from the spine.
- Brainstorm potential causes and write them on the respective bones.
3. 5 Whys Analysis
The 5 Whys Analysis is a simple yet effective tool for uncovering the root causes of a problem. By repeatedly asking "why," teams can peel away the layers of symptoms and reach the core issue.
How to use the 5 Whys Analysis:
- Start with a clear problem statement.
- Ask “why” the problem occurs and write down the answer.
- For each answer, ask “why” again until you reach the root cause (typically five times).
- Document each step to track your thought process.
4. Scatter Diagram
A Scatter Diagram is a graphical representation of the relationship between two variables. It helps identify correlations and trends in data, making it easier to determine which factors may be affecting the process.
How to use the Scatter Diagram:
- Identify the two variables you want to analyze.
- Collect data for both variables.
- Plot the data points on a graph with one variable on the X-axis and the other on the Y-axis.
- Look for patterns or correlations to determine if a relationship exists.
5. Histogram
A Histogram is a graphical representation of the distribution of numerical data. It helps teams understand the variation in processes and identify any abnormalities that may contribute to defects.
How to use the Histogram:
- Collect data points relevant to the process.
- Divide the range of data into intervals (bins).
- Count the number of data points in each interval and create bars representing these counts.
- Analyze the shape of the histogram to identify patterns or outliers.
Conclusion
The Analysis Phase is critical in the Six Sigma methodology, and using the right tools can significantly enhance your ability to identify and address issues within your processes. By implementing the Top 5 Tools of Six Sigma in Analysis Phase discussed above, organizations can systematically analyze data, uncover root causes, and drive continuous improvement.
FAQs
1. What is the primary goal of the Analysis Phase in Six Sigma?
The primary goal of the Analysis Phase is to analyze data collected during the Measure phase to identify root causes of problems, enabling teams to make informed decisions for improvement.
2. Can these tools be used in other phases of Six Sigma?
Yes, while these tools are particularly useful in the Analysis Phase, they can also be applied in other phases of Six Sigma for various purposes, such as problem definition and process improvement.
3. Is it necessary to use all these tools in the Analysis Phase?
No, it’s not necessary to use all these tools. The choice of tools depends on the specific problem being addressed and the data available.
4. How can I ensure a successful implementation of these tools?
Successful implementation requires team collaboration, clear problem definitions, and a commitment to data-driven decision-making. Training and practice can also enhance proficiency in using these tools.
Call to Action
Ready to enhance your organization's processes and drive continuous improvement? Start implementing the Top 5 Tools of Six Sigma in Analysis Phase today! If you have any questions or need further assistance, feel free to reach out. Let’s work together to achieve excellence in your processes!


Leave a Comment